Lecture #3: Mapping structural connectivity in the connectome with DTI
R. Cameron Craddock, PhD Research Scientist VI, Nathan S. Kline Institute for Psychiatric Research, New York, NY Director of Imaging, Child Mind Institute, New York, NY
July 30, 2014
Leftover from fMRI lecture
Constructing brain areas (Regions of Interests, ROIs) using clustering algorithms
Measuring functional interactions between brain areas
Brain Areas
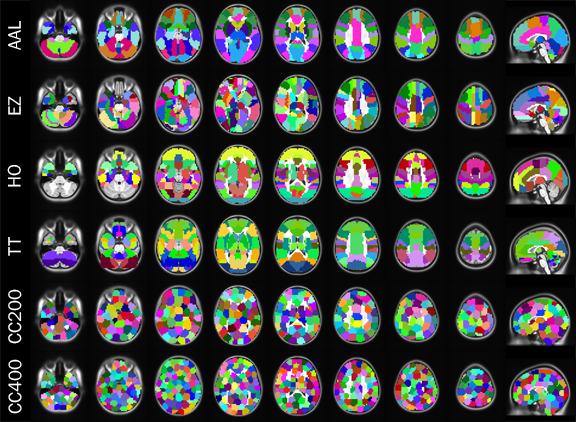
Different atlases for defining connectome nodes. Craddock et al., Nature Methods, 2013
To construct a connectome graph, you must first choose the areas to use as graph nodes
Voxels are a logical choice, but will result in very large connectomes
Alternatives are to use brain atlases derived from cytoarchitectonics, cortical landmarks, or from clustering data
Brain Areas
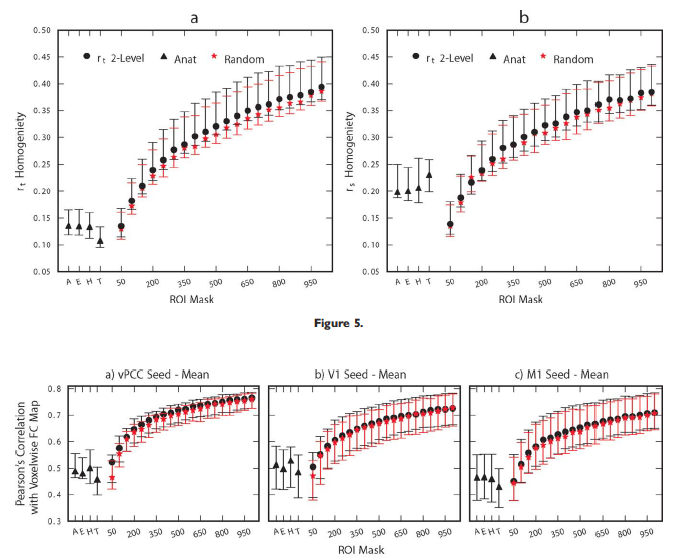
Different atlases provide different FC results. Craddock et al., Human Brain Mapping, 2011
Anatomical atlases provide good interpretability but may not accurately fit brain function
Best to derive brain areas from the data (can be done with functional and structural data)
Clustering Brain Data
Preprocess the data
Construct affinity matrix for each dataset
\(N_{vox} \times N_{vox}\) matrix where each entry corresponds to the similarity of the voxel's time course (fMRI), or connectivity pattern (fMRI or dMRI)
Constrain connectivity to just neighboring voxels
Cluster individual data
Several different clustering algorithms can be used
Combine clustering solution across datasets
Create affinity matrix for each clustering solution, where similarity is 1 if two voxels are in the same cluster, and 0 otherwise
Average affinity matrices across datasets
Perform group level clustering
Determine optimal number of clusters
Calculate clustering solutions with different numbers of clusters
No clear best solution, instead there is a continuum of solutions to choose from
Evaluation of different clustering solutions. Craddock et al., Human Brain Mapping, 2011
Creating Edges
Function interactions are typically measured using Pearson's correlation, although many other methods have been proposed \[\rho(v_i,v_j)=\frac{1}{T-1}\sum\limits_{t=0}^{T}\frac{(v_{i}[t]-\mu_{i})(v_{j}[t]-\mu_{j})}{\sigma_{i}\sigma_{j}}\]
\(v_i[t]\) and \(v_j[t]\) are the time courses for the \(i^{th}\) and \(j^{th}\) brain areas, respectively
\(T\) is the number of samples in a time course
\(\mu_i\) and \(\mu_j\) are the means of the \(i^{th}\) and \(j^{th}\) brain areas
\(\sigma_i\) and \(\sigma_j\) are the standard deviations of the \(i^{th}\) and \(j^{th}\) brain areas
Other Methods
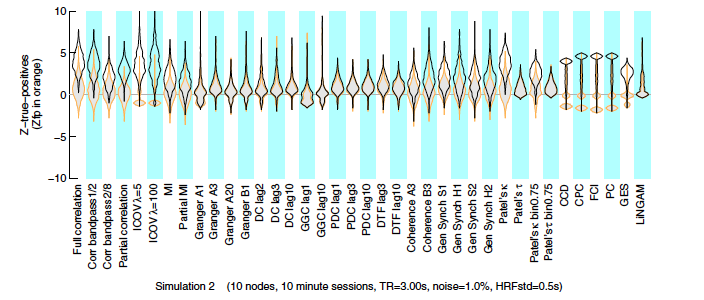
Comparison of different methods for calculating functional relationships. Smith et al., NeuroImage, 2011